This past week (January 22nd) the S&P 500 reached an all-time high. At the close of the day, the S&P closed higher than the previous high water mark which had been reach on January 3, 2022. The Dow and Nasdaq 100 reached their all time highs as well. In contrast, the Russell 2000 index is still about 20% below it’s all time high that it reached on November 8, 2021.
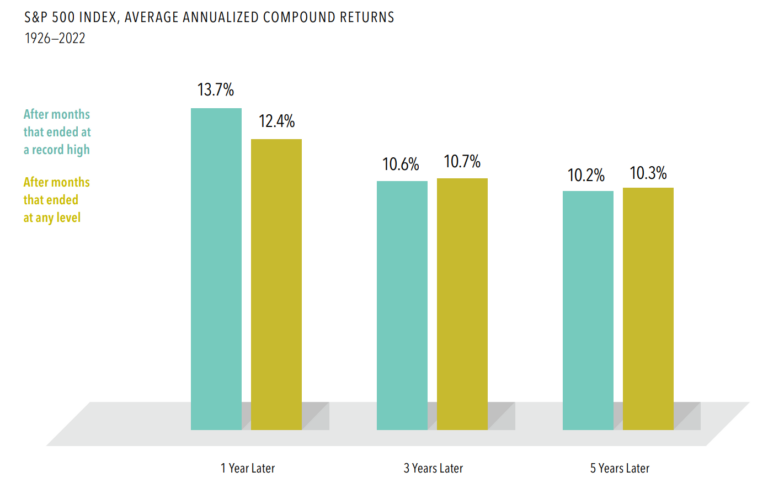
Many investors may believe that that markets highs signal that they should “get out of the market”. It is tempting to believe that since we’re experiencing market highs, we are about to reverse course and experience significant pull backs. However, historical data does not actually support that assumption. In fact, the average returns of the S&P 500 in the year following reaching new highs has been slightly higher, historically, than the returns in the year following all other months. If we examine all monthly closing level from 1926 to 2022 we find that 30% of months ended with new highs. This, of course, means that 70% of months end without being at an all time high. If we were to look forward one year for those 30% of the months that ended in a new high, we would find that the average return one year later was 13.7%. If we looked forward one year for the remaining 70% of the months we would see an increase of only 12.4%. In other words, the new record peak did not indicate an oncoming cliff.
Of course, we also were able to observe periods that were three and five years after the peaks as well. What we observed was that three years after reaching a peak the index had an annualized return of 10.6%. This number was only slighty lower than the 10.7% annualized return for the three years following all other months. The same pattern was observed when we looked at prices five years following new highs. The average annual return for the index five years after reaching new highs was 10.2% while the average annual return for the other months was 10.3%. In other words, there was no real reason to assume that new peaks were leading to financial cliffs.
Perhaps the most important lesson here is the reminder that being committed to a sustainable financial plan is the most important decision that an investor can make. By remaining invested over long periods of time a committed investor is most likely to achieve their goals.

Michael French
Head of Investments at 49 Financial